
Bart Matusiak Little Leaf
ux/product designer + information architect
LINK Driver
mobile application
DF Booking
web application module
US Wholesale
web application module
Data Dashboard
web application module
IDs
data taxonomy concept

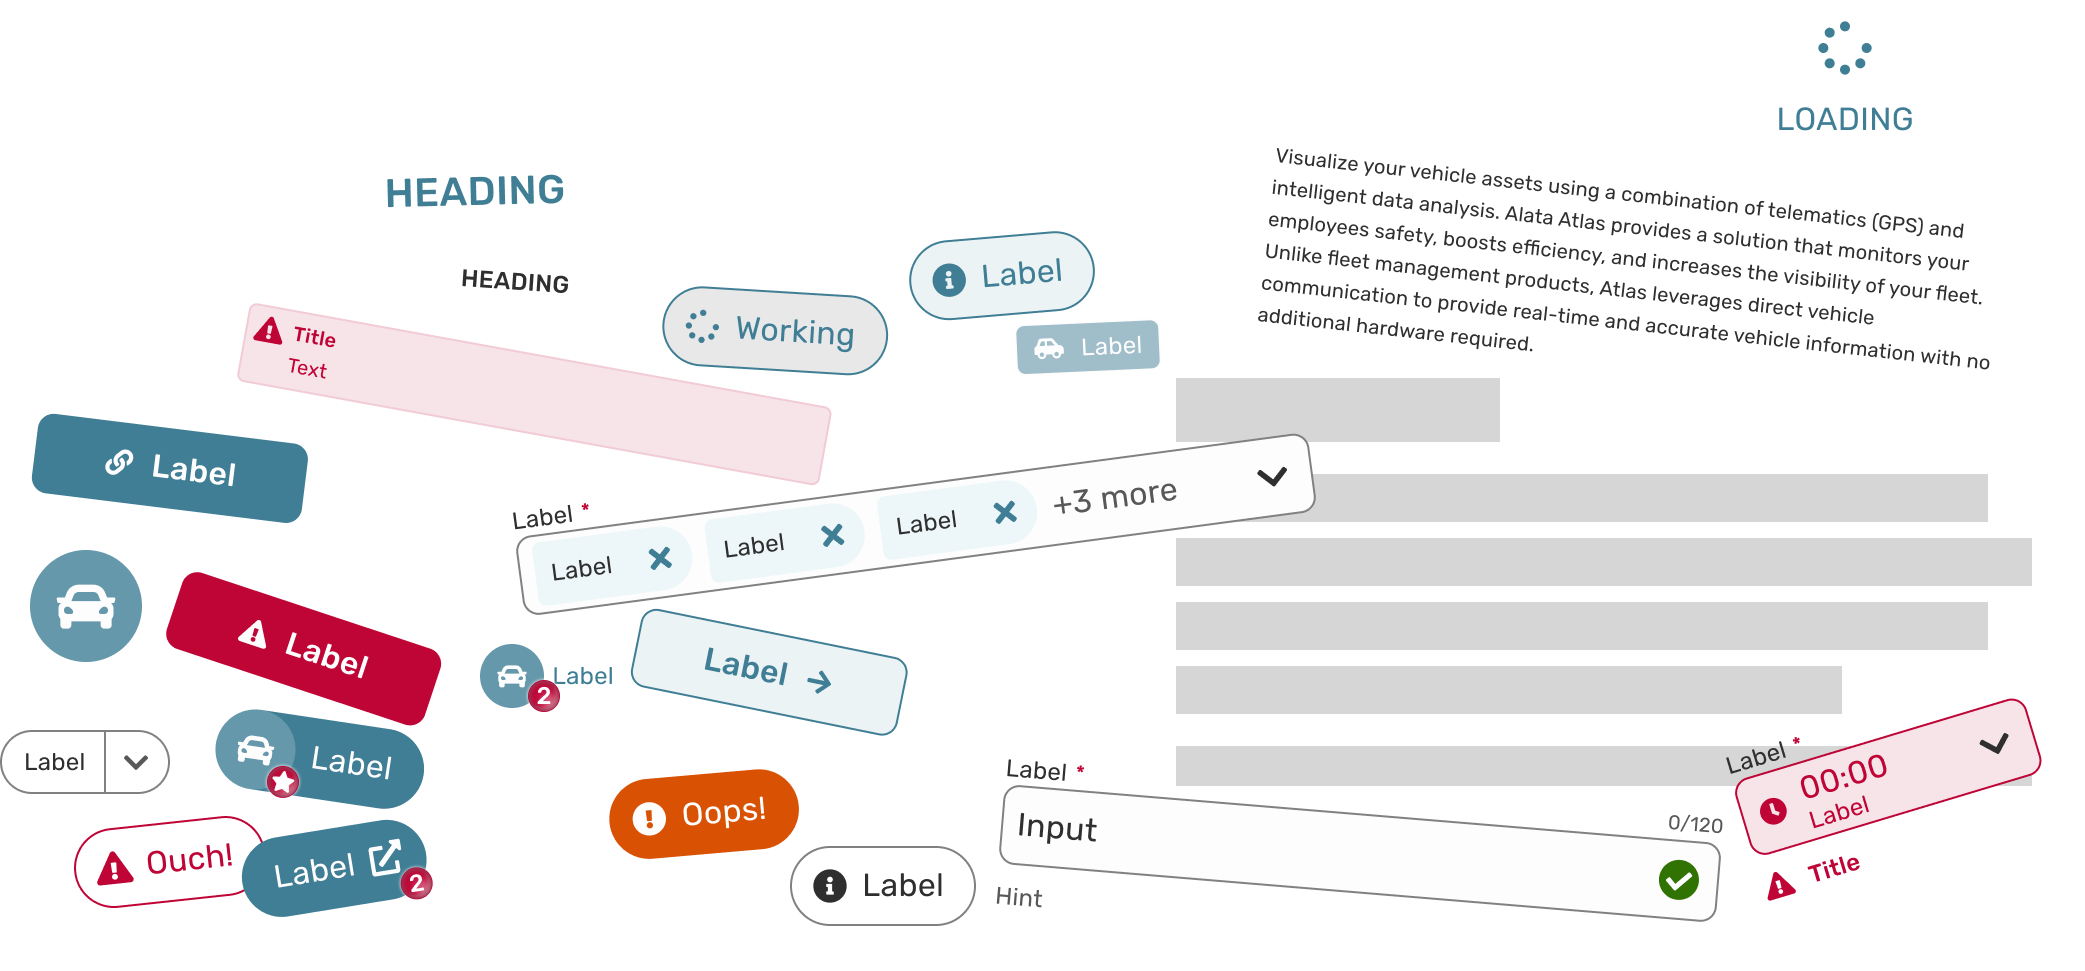
AL DS
design system
Data Dashboard
Web application designed for operators of fleets consisted of leased, rented, and owned units. The presented dashboard provides a general overview of fleet utilization, maintenance, and status. It allows data filtering by various parameters and can provide a detailed list of units included in the currently selected data set. Component of the Driving Force Customer Portal. Project for Alata Tech (part of The Driving Force Group of Companies).
My role: defining the scope and application functionality, aligning them with the original business requirements, and conducting further research. The allocated timeframe was ten design sprints, with the objective of delivering a set of high-fidelity wireframes that would represent the minimum viable product (MVP).
SITUATION
Operators of fleets, which include leased, rented, and owned units, require access to a dashboard that offers a comprehensive overview of their fleet’s utilization, maintenance, and overall status.
TASK
Define the scope and application functionality, ensuring they align with the original business requirements. Conduct further research to gather necessary information. Develop a set of high-fidelity wireframes that represent the minimum viable product (MVP).
ACTION
Engaging with users and conducting research to understand their needs. Identifying the primary areas of interest. Introducing data filtering options based on various parameters that not only provide an overview of a specific subset of assets but also display a detailed list of units within the currently selected data set. Designing a set of high-fidelity wireframes and a clickable prototype that demonstrates the dashboard’s functionality.
RESULT
Application that allows tenants - fleet operators - access to important data about their fleets and helps them to make informed decisions regarding their utilization and renewal.
Research
I conducted several interviews with Users and Stakeholders. Collected notes were synthesized as a single user persona: Fleet Manager.
Synthesis
Based on research results, I defined a set of key performance indicators to be represented on the set of dashboards:
- Assets,
- Operations,
- Rental Utilization,
- Replacement (out of MVP scope),
- Maintenance (out of MVP scope),
- Finances (out of MVP scope).
The findings guided the final design by defining the desired interaction as a journey from general information to the list of separate assets included in the filtered dataset represented on the dashboard at the given moment.
Ideation
The next step involved defining the scope of indicators placed on each of the three dashboards defined as a part of MVP stage.
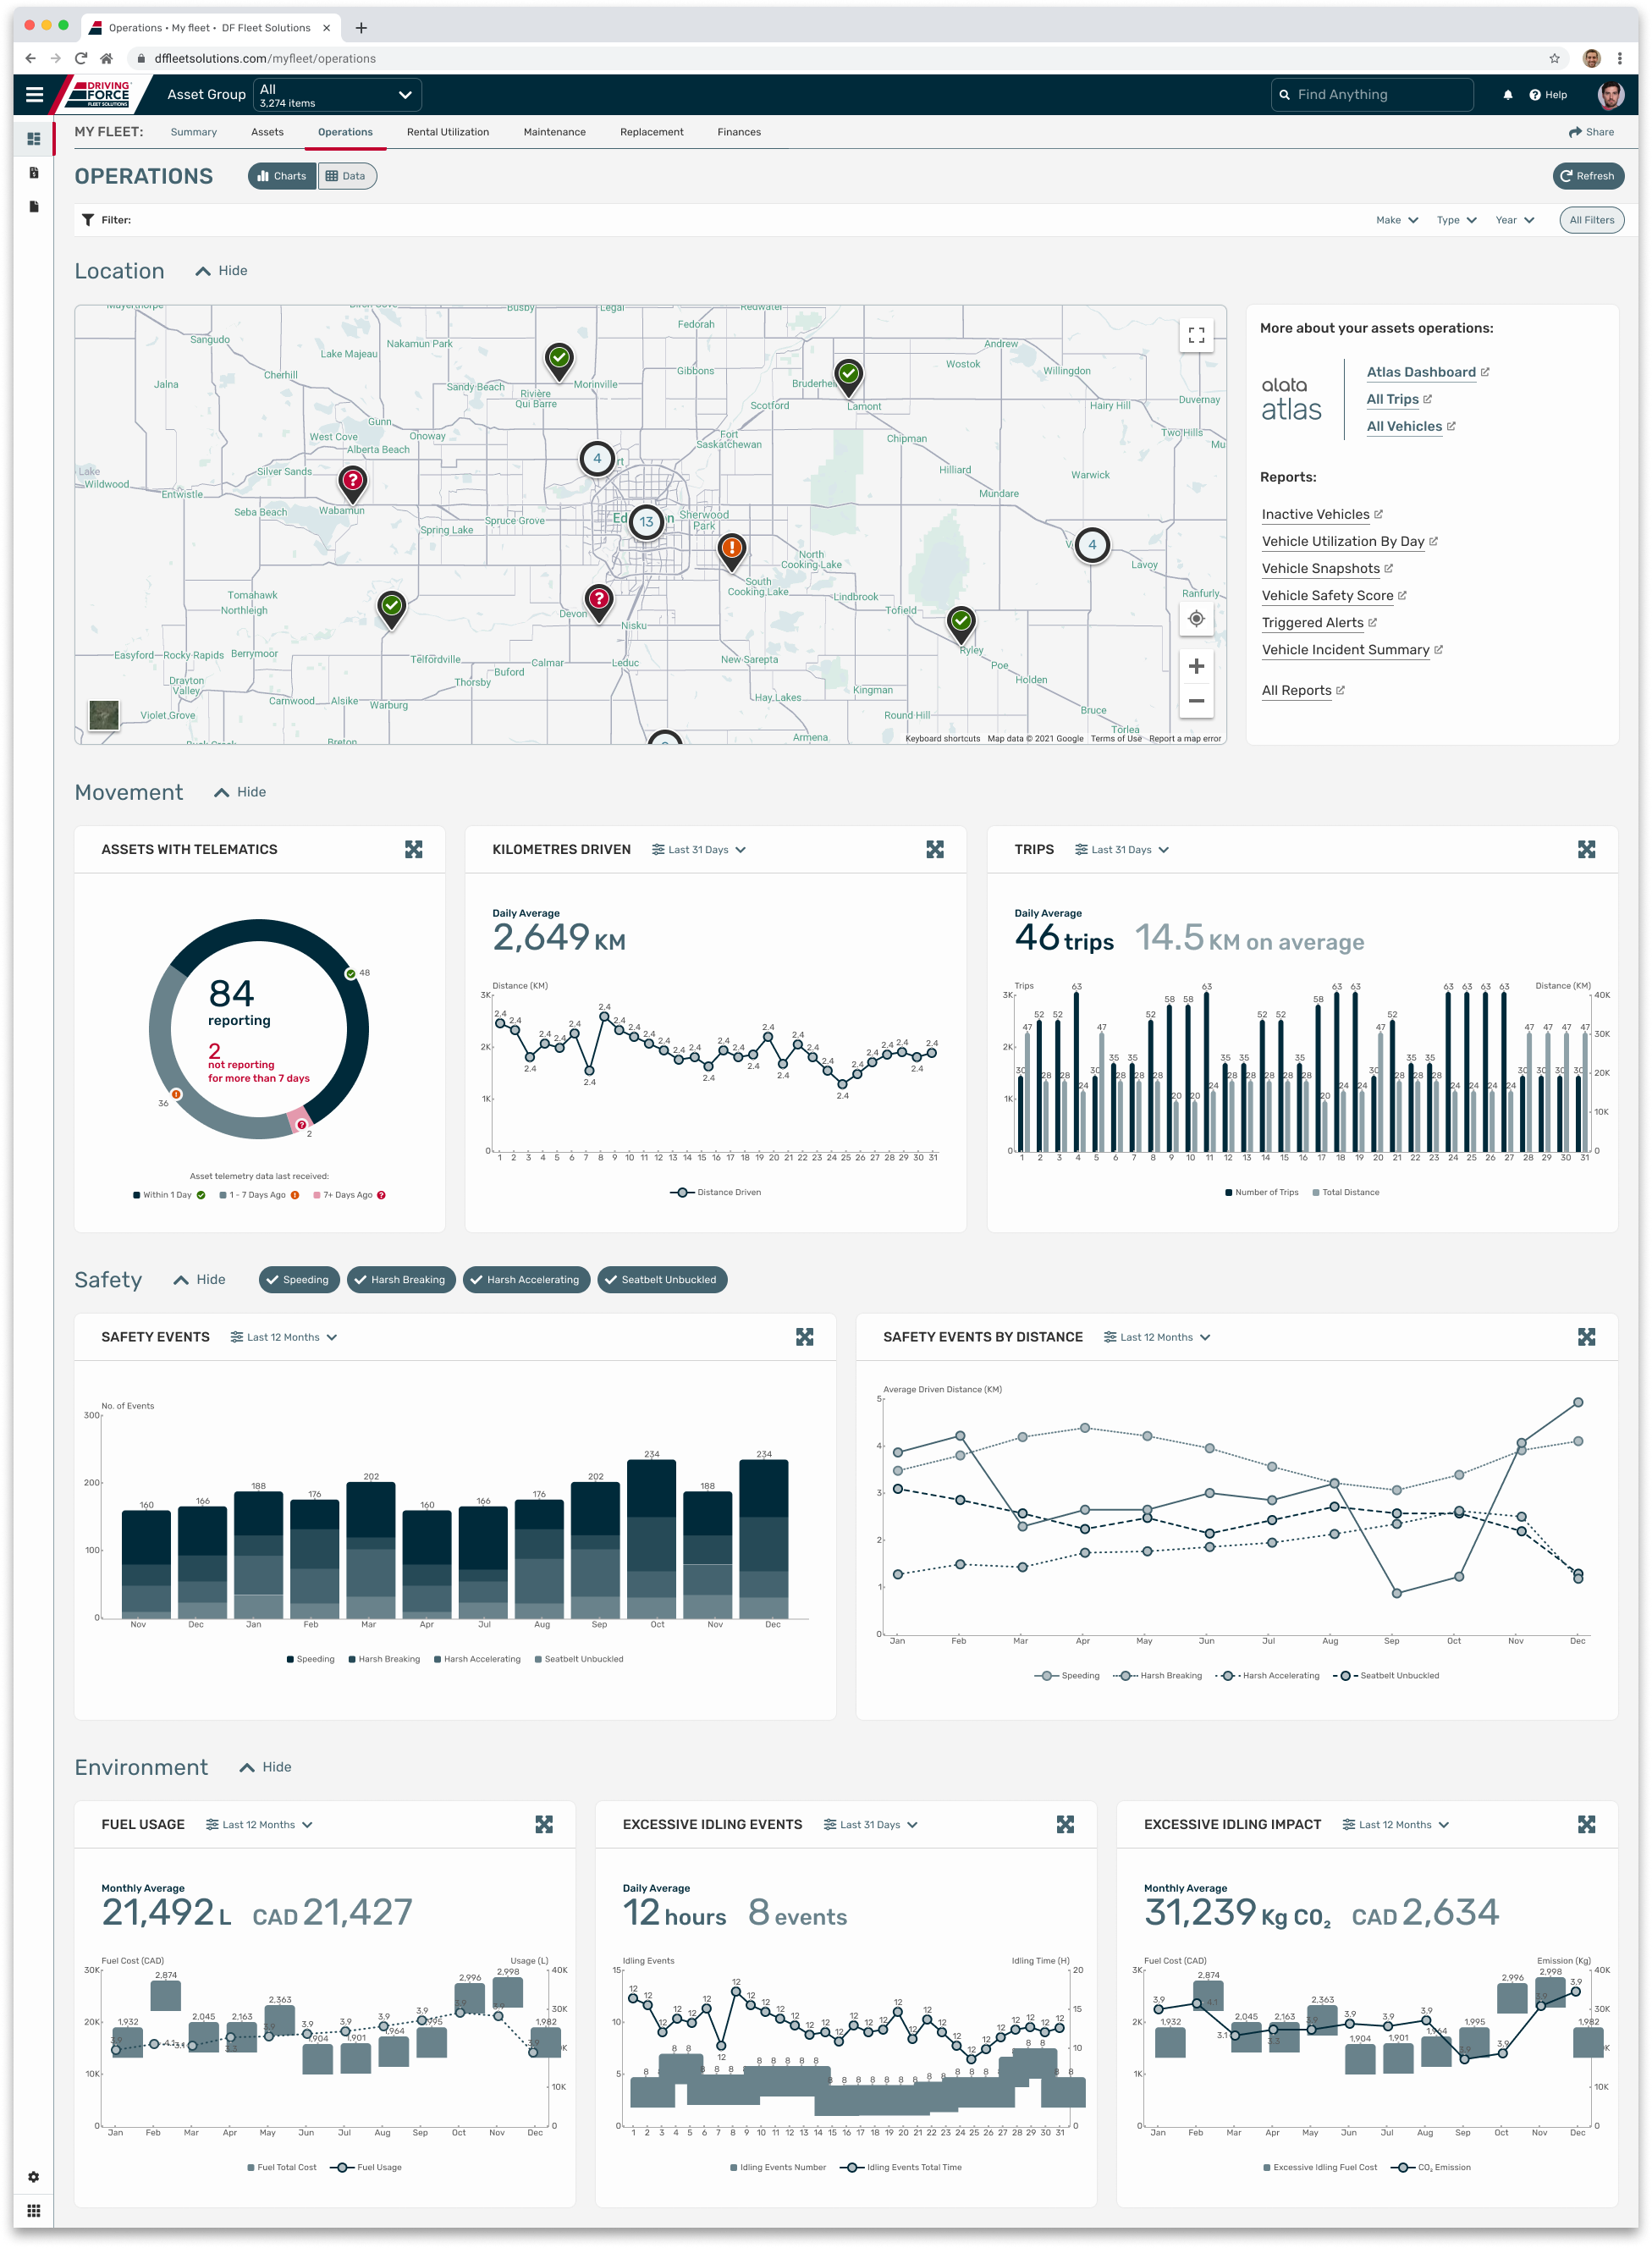
Designed activity scenario established the way of interacting with dashboards through selection of filters, or direct selection on the graphs.
Design
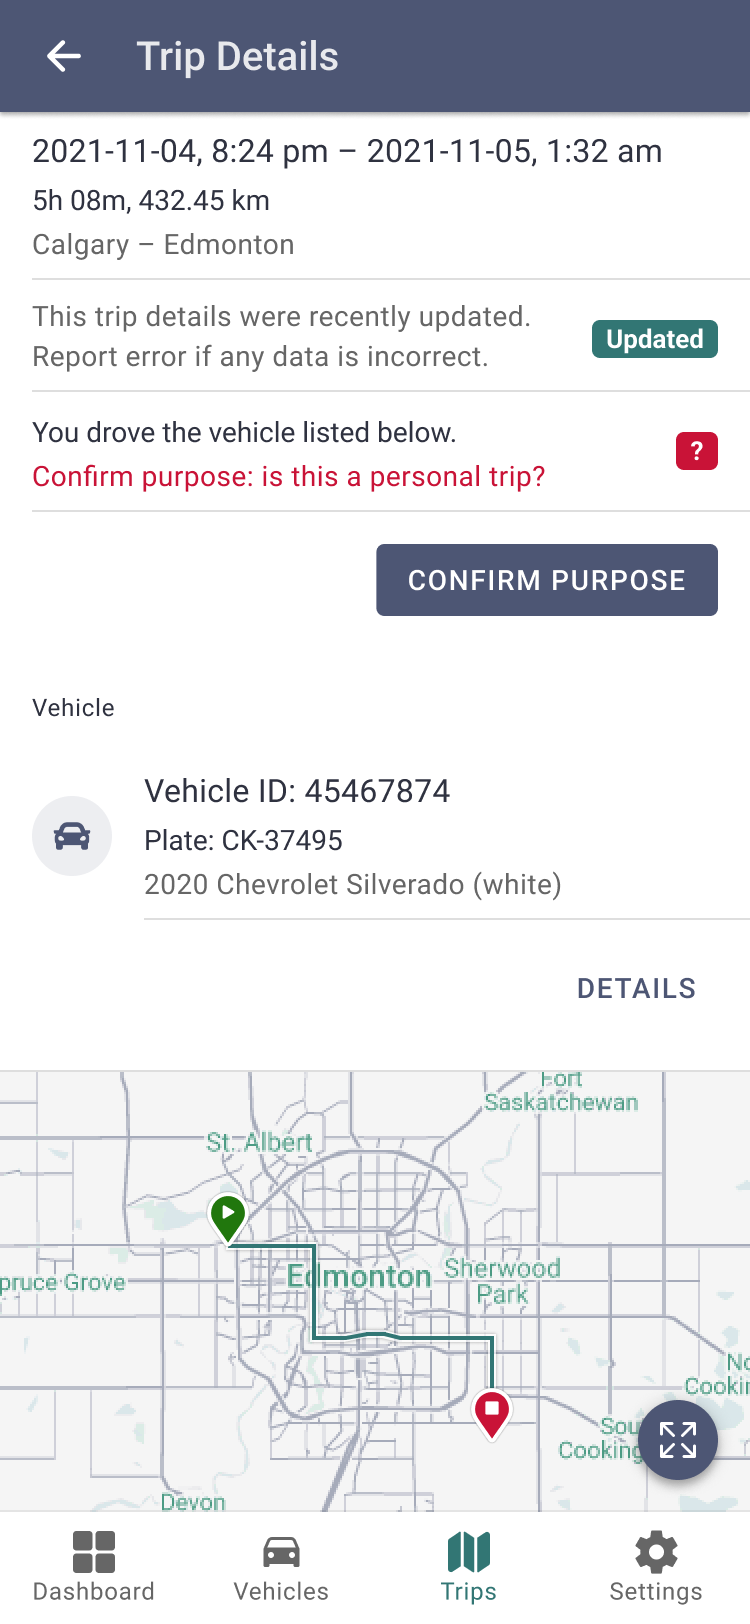
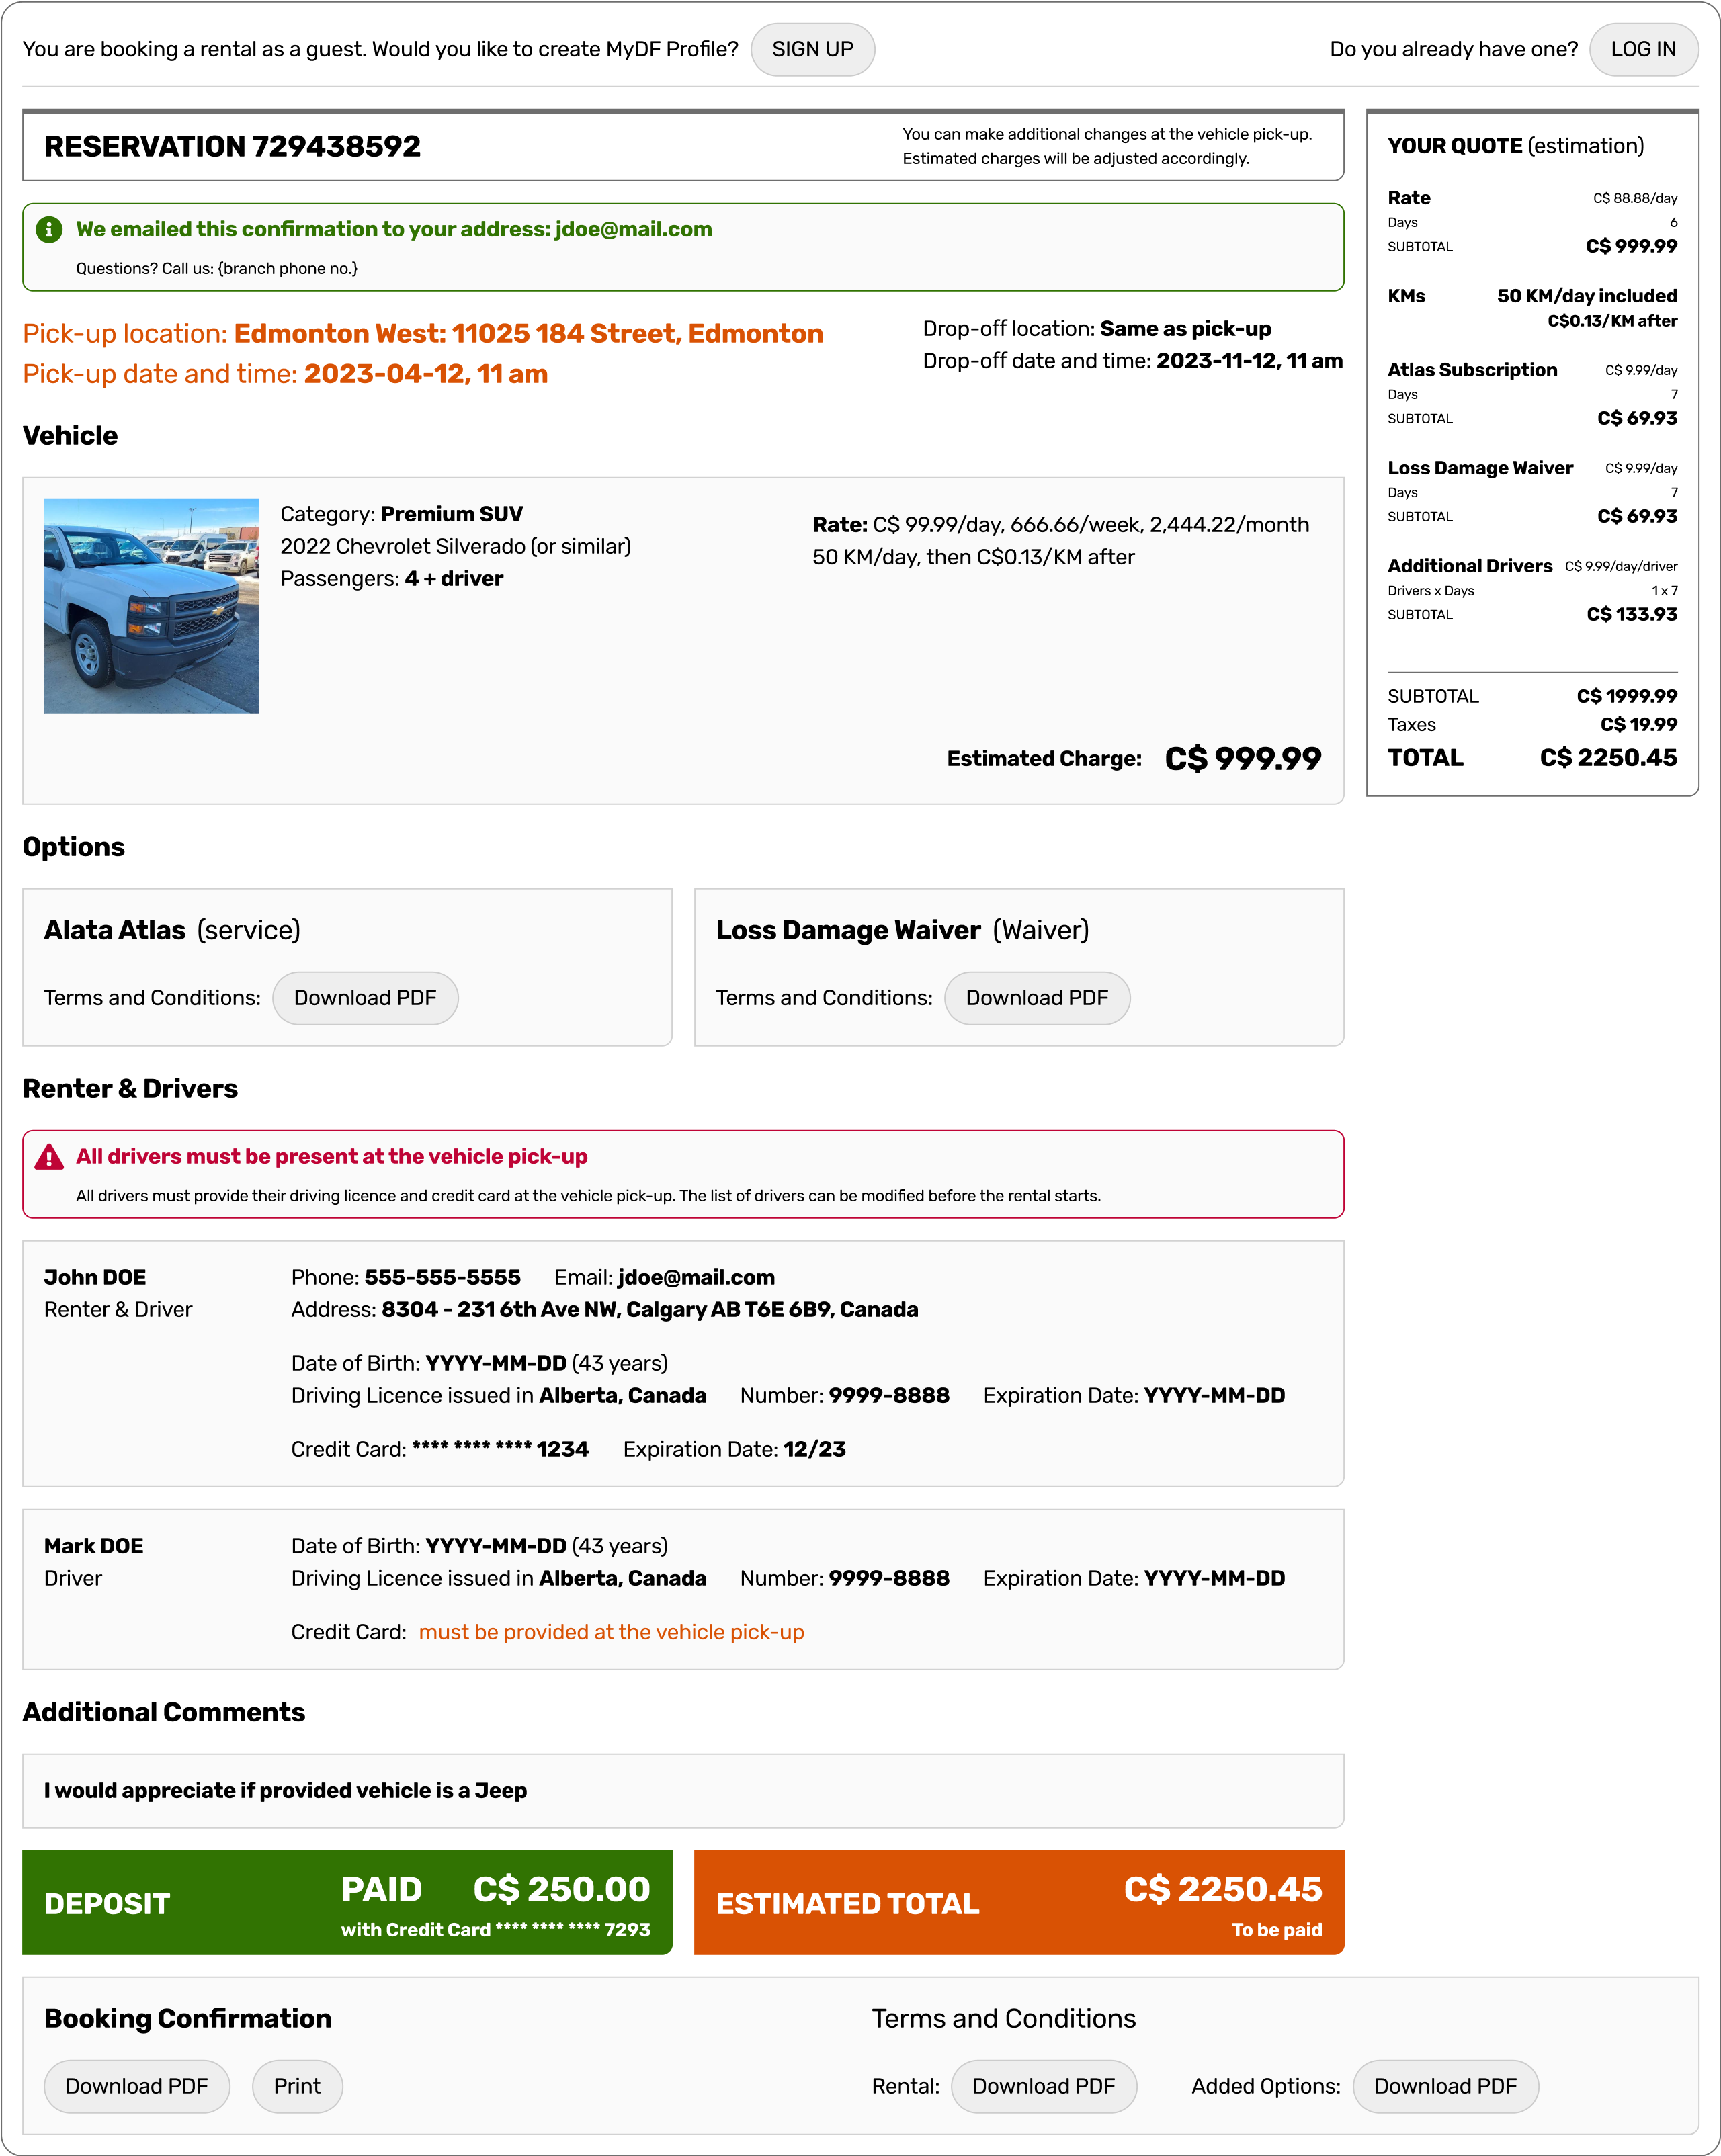
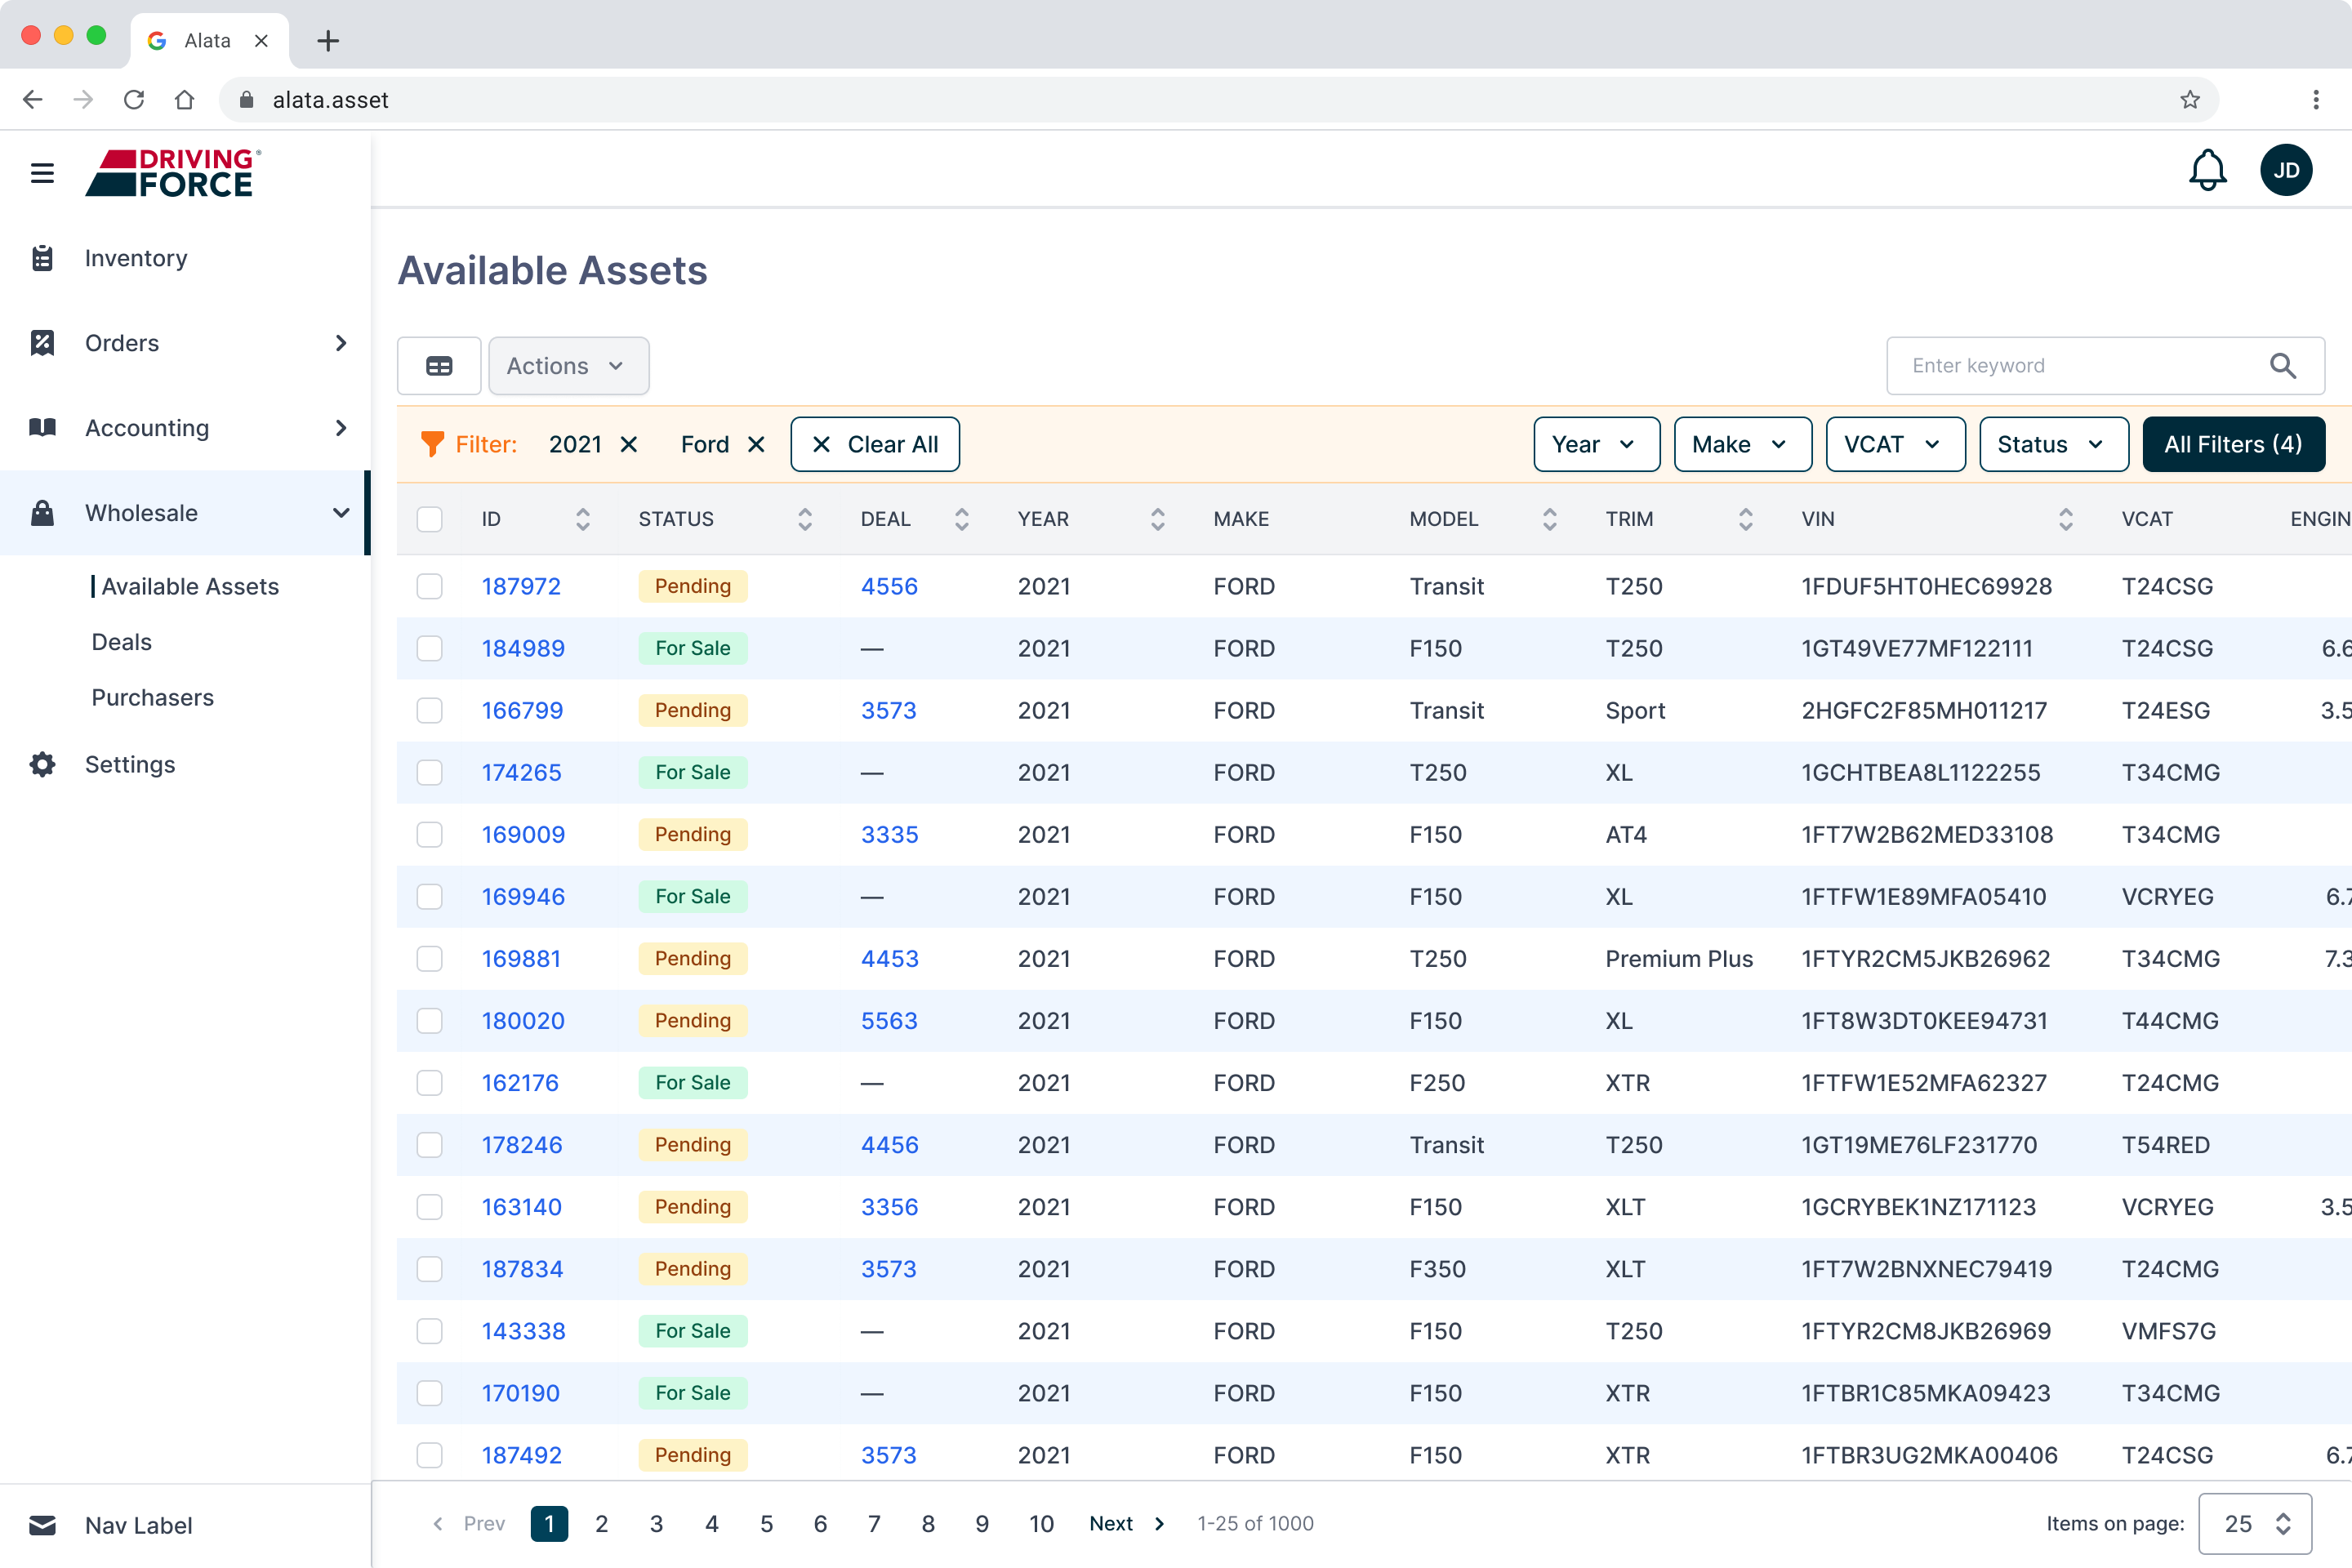
In the final phase, I developed high-fidelity wireframes by utilizing the components and rules established by AL DS (AL Design System).
Defined activity scenarios were tested using high-fidelity wireframes that were subsequently combined into a clickable prototype. The identified modifications were subsequently implemented.
Selected Wireframes (High Fidelity):
Handover
The complete design, including the prototype, all flows, diagrams, and annotated wireframes, was presented and handed over to the development team. I was also involved in Jira ticket writing, providing additional input from a design perspective and ensuring that every aspect of the prepared design was included.
Later, I also took part in final testing and QA to check if all functional and visual aspects were correctly implemented.
Projects
DISCLAIMER: All projects and designs shown in this portfolio have been created by myself, or as part of a team; working as a freelance contractor or a full-time employee. They belong to their legal owners and are being shown here for informational purposes only.
Made with Figma Sites
Bart Matusiak Little Leaf
ux/product designer + information architect
LINK Driver
mobile application
DF Booking
web application module
US Wholesale
web application module
Data Dashboard
web application module
IDs
data taxonomy concept
AL DS
design system
Data Dashboard
Web application designed for operators of fleets consisted of leased, rented, and owned units. The presented dashboard provides a general overview of fleet utilization, maintenance, and status. It allows data filtering by various parameters and can provide a detailed list of units included in the currently selected data set. Component of the Driving Force Customer Portal. Project for Alata Tech (part of The Driving Force Group of Companies).
My role: defining the scope and application functionality, aligning them with the original business requirements, and conducting further research. The allocated timeframe was ten design sprints, with the objective of delivering a set of high-fidelity wireframes that would represent the minimum viable product (MVP).
SITUATION
Operators of fleets, which include leased, rented, and owned units, require access to a dashboard that offers a comprehensive overview of their fleet’s utilization, maintenance, and overall status.
TASK
Define the scope and application functionality, ensuring they align with the original business requirements. Conduct further research to gather necessary information. Develop a set of high-fidelity wireframes that represent the minimum viable product (MVP).
ACTION
Engaging with users and conducting research to understand their needs. Identifying the primary areas of interest. Introducing data filtering options based on various parameters that not only provide an overview of a specific subset of assets but also display a detailed list of units within the currently selected data set. Designing a set of high-fidelity wireframes and a clickable prototype that demonstrates the dashboard’s functionality.
RESULT
Application that allows tenants - fleet operators - access to important data about their fleets and helps them to make informed decisions regarding their utilization and renewal.
Research
I conducted several interviews with Users and Stakeholders. Collected notes were synthesized as a single user persona: Fleet Manager.
Synthesis
Based on research results, I defined a set of key performance indicators to be represented on the set of dashboards:
- Assets,
- Operations,
- Rental Utilization,
- Replacement (out of MVP scope),
- Maintenance (out of MVP scope),
- Finances (out of MVP scope).
The findings guided the final design by defining the desired interaction as a journey from general information to the list of separate assets included in the filtered dataset represented on the dashboard at the given moment.
Ideation
The next step involved defining the scope of indicators placed on each of the three dashboards defined as a part of MVP stage.
Designed activity scenario established the way of interacting with dashboards through selection of filters, or direct selection on the graphs.
Design
In the final phase, I developed high-fidelity wireframes by utilizing the components and rules established by AL DS (AL Design System).
Defined activity scenarios were tested using high-fidelity wireframes that were subsequently combined into a clickable prototype. The identified modifications were subsequently implemented.
Selected Wireframes (High Fidelity):
Handover
The complete design, including the prototype, all flows, diagrams, and annotated wireframes, was presented and handed over to the development team. I was also involved in Jira ticket writing, providing additional input from a design perspective and ensuring that every aspect of the prepared design was included.
Later, I also took part in final testing and QA to check if all functional and visual aspects were correctly implemented.
Projects
DISCLAIMER: All projects and designs shown in this portfolio have been created by myself, or as part of a team; working as a freelance contractor or a full-time employee. They belong to their legal owners and are being shown here for informational purposes only.
Made with Figma Sites
Bart Matusiak Little Leaf
ux/product designer + information architect
DF Booking
web application module
US Wholesale
web application module
Data Dashboard
web application module
IDs
data taxonomy concept
LINK Driver
mobile application
AL DS
design system
Data Dashboard
Web application designed for operators of fleets consisted of leased, rented, and owned units. The presented dashboard provides a general overview of fleet utilization, maintenance, and status. It allows data filtering by various parameters and can provide a detailed list of units included in the currently selected data set. Component of the Driving Force Customer Portal. Project for Alata Tech (part of The Driving Force Group of Companies).
My role: defining the scope and application functionality, aligning them with the original business requirements, and conducting further research. The allocated timeframe was ten design sprints, with the objective of delivering a set of high-fidelity wireframes that would represent the minimum viable product (MVP).
SITUATION
Operators of fleets, which include leased, rented, and owned units, require access to a dashboard that offers a comprehensive overview of their fleet’s utilization, maintenance, and overall status.
TASK
Define the scope and application functionality, ensuring they align with the original business requirements. Conduct further research to gather necessary information. Develop a set of high-fidelity wireframes that represent the minimum viable product (MVP).
ACTION
Engaging with users and conducting research to understand their needs. Identifying the primary areas of interest. Introducing data filtering options based on various parameters that not only provide an overview of a specific subset of assets but also display a detailed list of units within the currently selected data set. Designing a set of high-fidelity wireframes and a clickable prototype that demonstrates the dashboard’s functionality.
RESULT
Application that allows tenants - fleet operators - access to important data about their fleets and helps them to make informed decisions regarding their utilization and renewal.
Research
I conducted several interviews with Users and Stakeholders. Collected notes were synthesized as a single user persona: Fleet Manager.
Synthesis
Based on research results, I defined a set of key performance indicators to be represented on the set of dashboards:
- Assets,
- Operations,
- Rental Utilization,
- Replacement (out of MVP scope),
- Maintenance (out of MVP scope),
- Finances (out of MVP scope).
The findings guided the final design by defining the desired interaction as a journey from general information to the list of separate assets included in the filtered dataset represented on the dashboard at the given moment.
Ideation
The next step involved defining the scope of indicators placed on each of the three dashboards defined as a part of MVP stage.
Designed activity scenario established the way of interacting with dashboards through selection of filters, or direct selection on the graphs.
Design
In the final phase, I developed high-fidelity wireframes by utilizing the components and rules established by AL DS (AL Design System).
Defined activity scenarios were tested using high-fidelity wireframes that were subsequently combined into a clickable prototype. The identified modifications were subsequently implemented.
Selected Wireframes (High Fidelity):
Handover
The complete design, including the prototype, all flows, diagrams, and annotated wireframes, was presented and handed over to the development team. I was also involved in Jira ticket writing, providing additional input from a design perspective and ensuring that every aspect of the prepared design was included.
Later, I also took part in final testing and QA to check if all functional and visual aspects were correctly implemented.
Projects
DISCLAIMER: All projects and designs shown in this portfolio have been created by myself, or as part of a team; working as a freelance contractor or a full-time employee. They belong to their legal owners and are being shown here for informational purposes only.
Made with Figma Sites